
Engineering leadership · Reporting
The monthly engineering report that eats a day, and why nobody trusts it
Last working day of the month. The engineering lead has the tracker open in one tab, the code host in another, the CI dashboard, the cloud portal, two AI invoices and last month’s spreadsheet. By the afternoon there is a slide. In the meeting, the first question is about a number on it, and the honest answer is “I’ll check”.
Nythrex team · 10/29/2026
In brief
6-minute read · For engineering leads · 29 October 2026
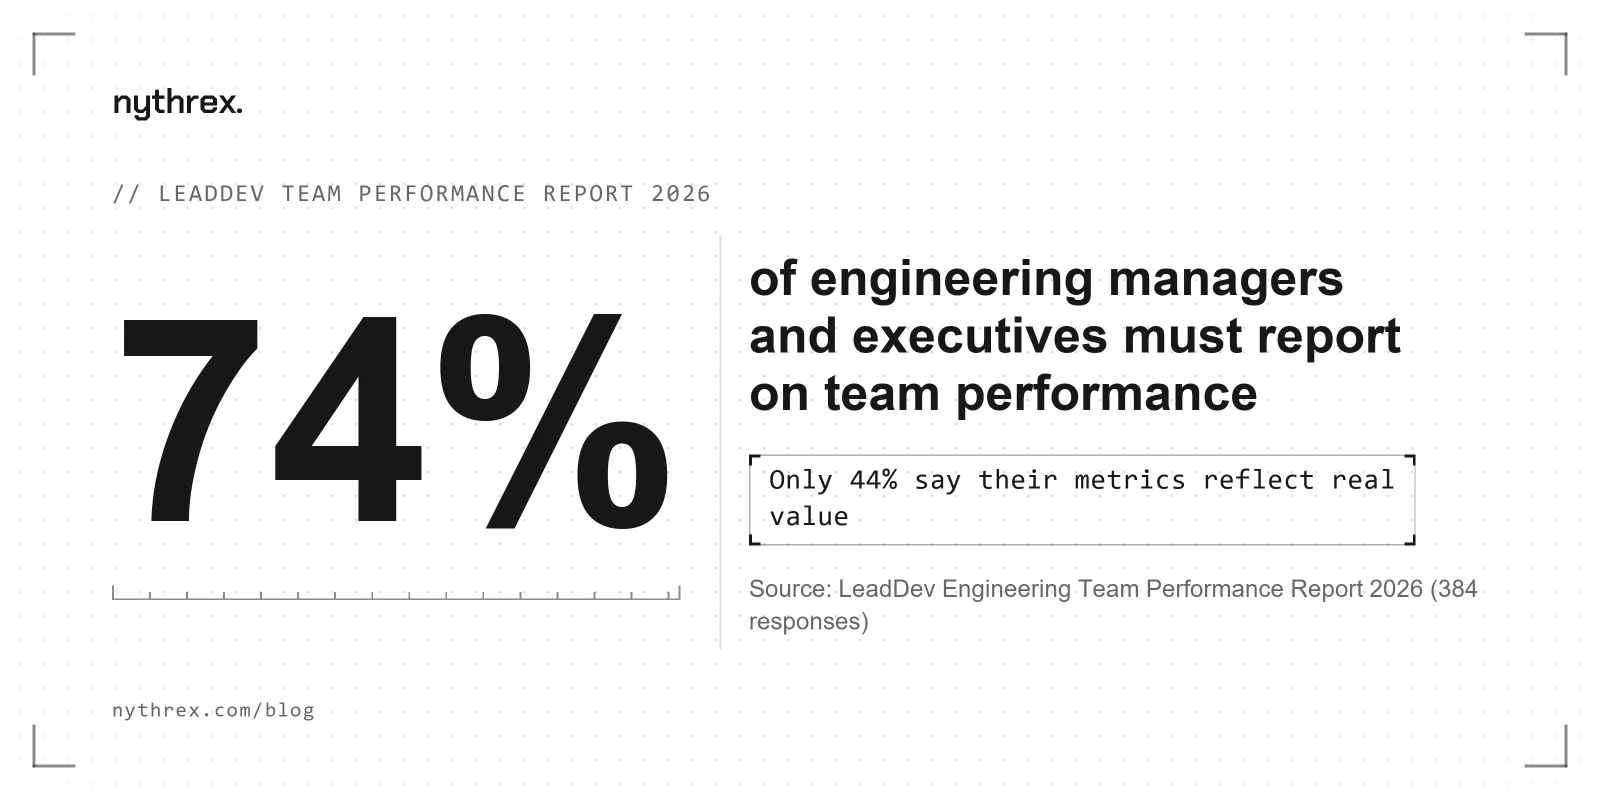
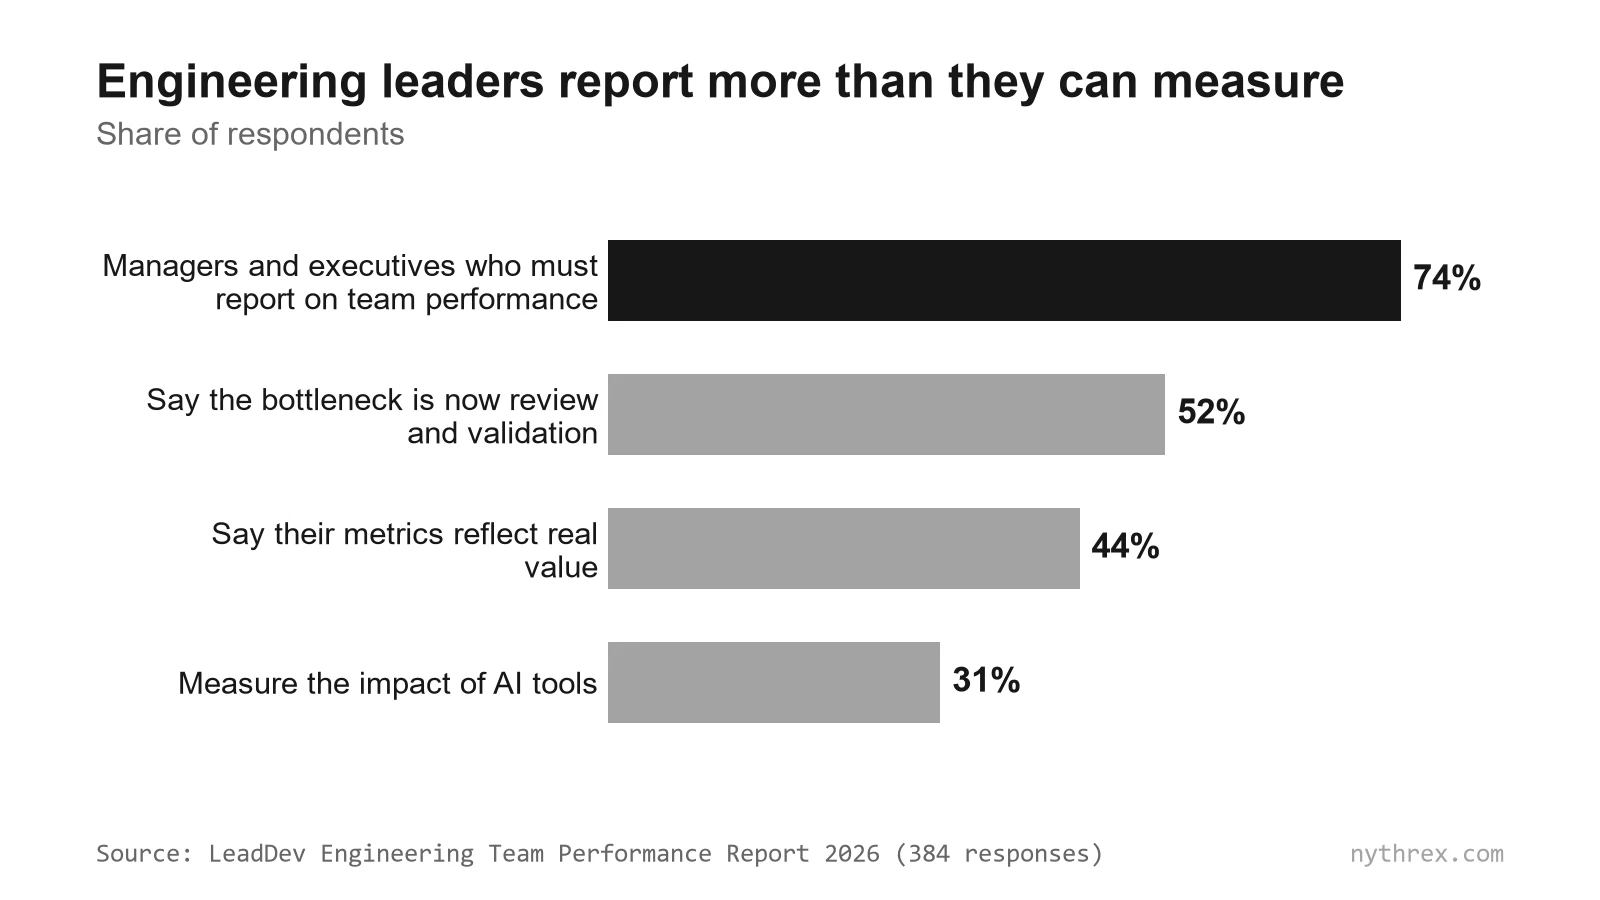
- Reporting is part of the job. 74% of engineering managers and executives must report on team performance, against fewer than half of other respondents.
- Trust is low. Only 44% say their metrics reflect real value, and just 31% measure the impact of AI tools.
- Information is scattered. Atlassian found half of developers lose 10 or more hours a week to friction, with finding information among the top causes.
- The fix is fewer questions, fixed definitions and a source behind every number.
What leaders report
LeadDev’s 2026 report, based on 384 responses, describes a profession that reports constantly and doubts what it reports. It also finds the delivery bottleneck has moved: 52% say it is now code review and validation, and only 7% say it is writing code. A report built on output counts misses exactly the part that changed.
Anatomy of the report
| Question from the founder or client | Where the answer lives | How it is usually assembled |
|---|---|---|
| What did we ship? | Tracker and code host | Filtered lists, copied by hand |
| Are we on track? | Tracker, pull requests, deploys | Judgement, sometimes a burndown |
| What did it cost? | AI invoices, CI bill, cloud portal, payroll | A spreadsheet, rarely by project |
| Is AI paying off? | Nowhere in one place | Anecdotes |
| What needs attention? | Everywhere | Memory |
A number that can’t be traced to its source will be argued about in the meeting.
Why the numbers don’t get trusted
- Definitions drift. “Done” means merged one month and deployed the next.
- Copies go stale. A figure pasted on Thursday is wrong by Friday’s meeting.
- Gaps get filled with guesses. A missing invoice becomes last month’s number, or zero.
- Nothing links back. Readers cannot click from a total to the records behind it.
Atlassian’s 2025 developer experience research shows the same fragmentation one level down: developers spend about 16% of their time coding, and 63% say leaders don’t understand their pain points, up from 44% a year earlier. The report is where that gap becomes visible.
A report that mostly writes itself
- 1
Answer three questions, not twenty
What shipped, what it cost, what needs attention. Everything else is an appendix. - 2
Fix the definitions once
Write down what counts as shipped and which costs are included. Use the same rules every month. - 3
Give every number a source
A total should open into the tasks, pull requests, runs and invoices behind it. - 4
Show unknowns instead of guessing
A total with a missing source should say so. Readers trust a marked gap more than a smooth number. - 5
Deliver it on a schedule
If the report arrives on its own every week, the monthly meeting starts from the same facts for everyone.
Where Nythrex fits
Nythrex reads the tracker, code host, CI, AI tools and cloud with read-only access and puts them in one picture by project, team and period: headline figures first, then what needs attention, then the evidence behind each number. An optional weekly email sends the highlights. It does not rank people or score productivity.
Sources
Frequently asked questions
How many engineering managers have to report on team performance?
In LeadDev’s 2026 Engineering Team Performance Report, 74% of managers and executives said they must report on team performance, against fewer than half of other respondents.
Why don’t leaders trust engineering metrics?
Only 44% of LeadDev’s respondents say their metrics reflect real value. Common reasons are drifting definitions, figures copied by hand from several tools, gaps filled with guesses and totals that cannot be traced to their source.
What should a monthly engineering report contain?
Three answers: what shipped, what it cost and what needs attention, with fixed definitions, a source behind every number and missing data marked rather than guessed.
Read next
- Measure AI, not the people using itLeaders need to show what AI is worth, and the easiest metric is usage per person. Developers fear it, it pushes costs up, and Meta has already dropped it from reviews. The better unit is the change, not the engineer.Read
- The cloud bill went up. Which project did it?Managing cloud spend is the top cloud challenge for 85% of organizations, and estimated waste rose for the first time in five years. For a team without a FinOps department, the first question is simple and hard: which project caused the increase?Read
- How Nythrex works: from AI session to productionHow Nythrex links the task, AI session, commit, pull request, CI run, deployment and cloud into one unit of work with its own cost and the basis for every figure.Read
Stop guessing.
Start seeing.
No card and no subscription: paid plans have not launched yet.