
Cloud · Costs
The cloud bill went up. Which project did it?
It happens at the start of the month. The cloud invoice is higher than last time, finance forwards it with one line, “why?”, and the engineering lead opens the cost portal. It shows services and regions. It does not show products, clients or the feature that went live on the 12th. So the answer becomes a guess, and the next month the same thing happens again.
Nythrex team · 10/29/2026
In brief
6-minute read · For engineering leads and founders · 29 October 2026
- Still the top challenge. 85% of respondents to Flexera’s 2026 survey name managing cloud spend as a top challenge.
- Waste is rising again. Respondents estimate 29% of cloud spend is wasted, up from 27%: the first increase in five years, as AI workloads grow.
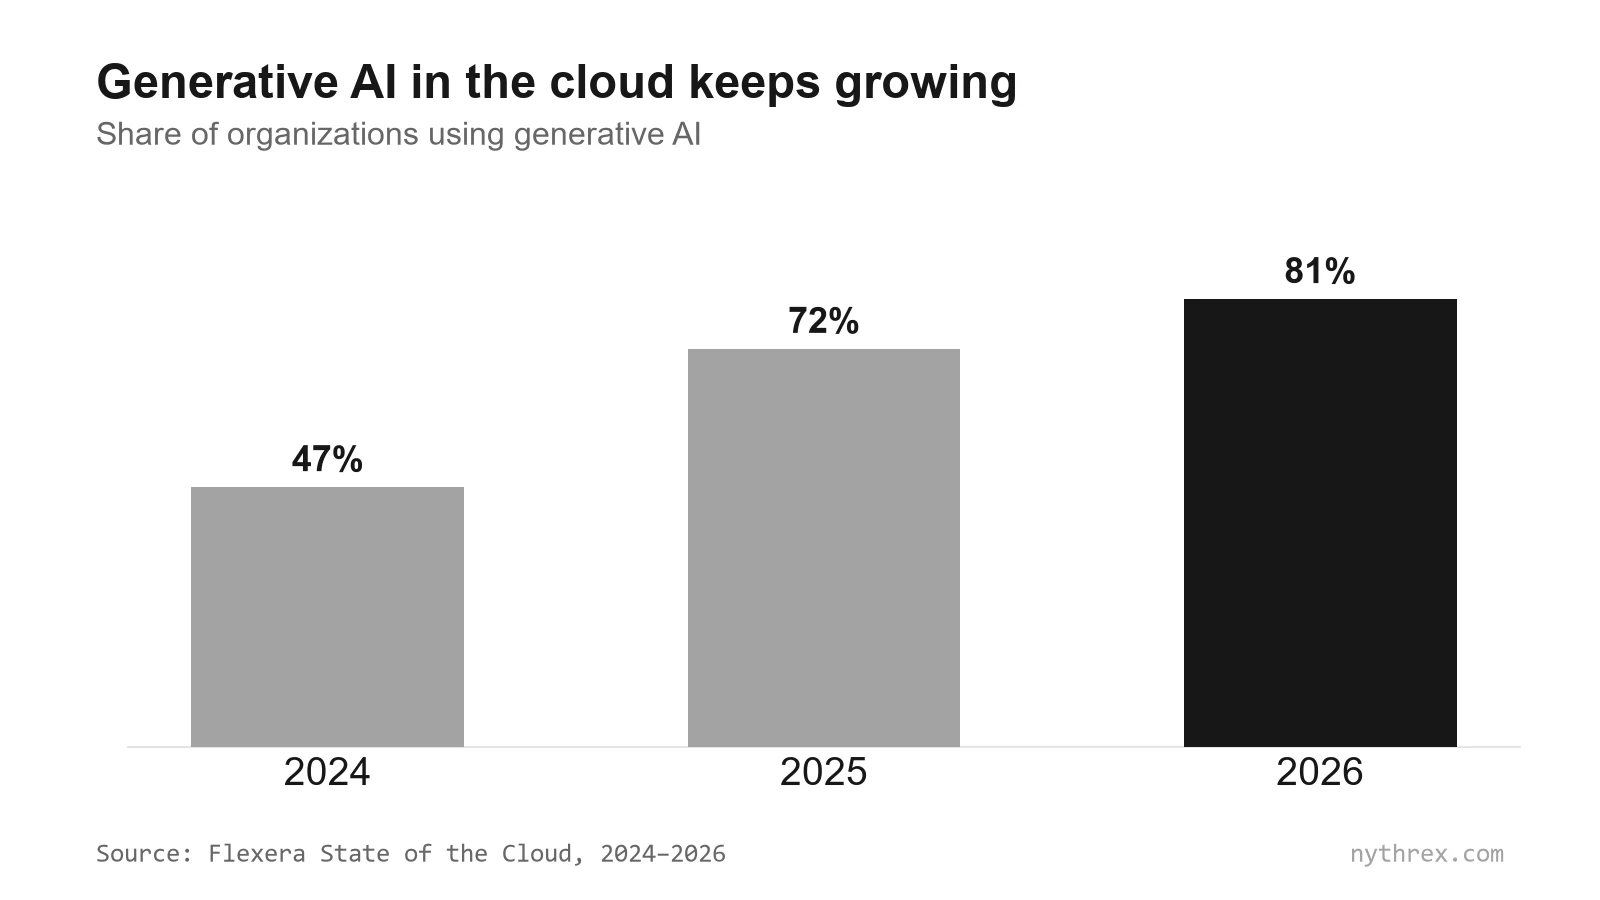
- AI is now in the cloud bill. 81% of organizations use generative AI, up from 47% in 2024.
- The first fix is not a FinOps team. It is knowing which project every resource belongs to.
What the survey says
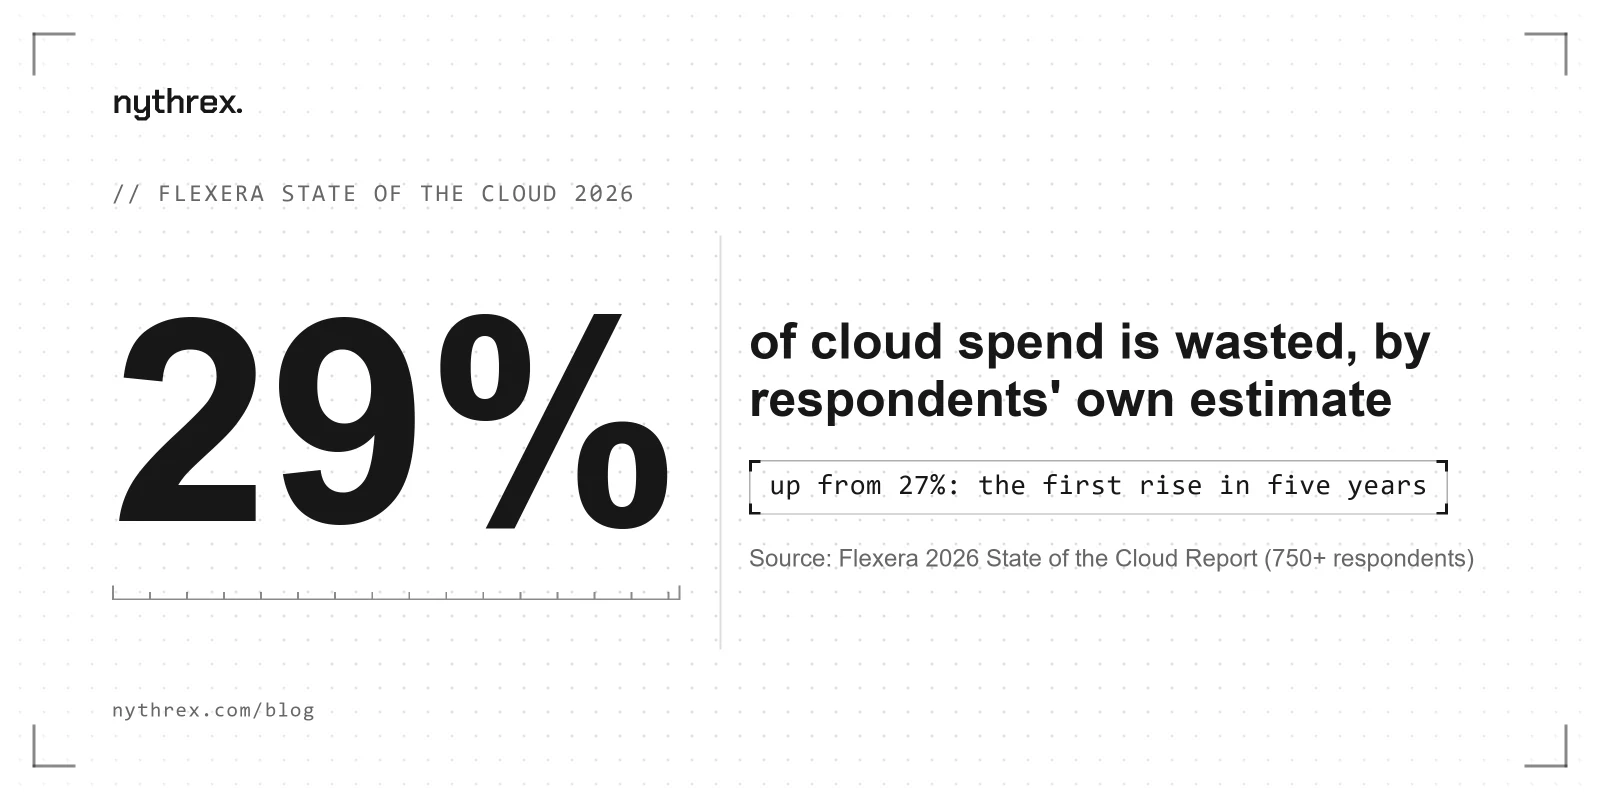
Flexera’s fifteenth annual report surveyed more than 750 cloud decision-makers. Its headline is that cloud value is rising while AI waste grows. Many respondents answer with structure: 63% have FinOps teams and 71% run a cloud centre of excellence. A company with 30 or 150 engineers often has neither, and still gets the same invoice questions.
Why the bill is hard to read
- The invoice speaks services, not products. Compute, storage and networking say nothing about which product or client they served.
- Shared environments blur ownership. One subscription with staging for three projects cannot be split after the fact.
- Tags are added later, if at all. Untagged resources become a growing line called “other”.
- AI services scale with usage. Model endpoints are billed by tokens or capacity, so a new feature can change the bill without any new infrastructure.
If a resource has no project, its cost has no explanation.
Usual suspects for an unexplained increase
| Cause | How it looks on the invoice | Where to check |
|---|---|---|
| A new environment for a feature or client | More compute and databases in the same services | Resources created this month, by project |
| AI features going live | A new or growing AI service line | Deploys of the project that uses it |
| Environments left running | Steady cost with no traffic | Staging and preview resources older than their branch |
| Logs and data transfer | Storage and bandwidth creeping up | Retention settings and new integrations |
A month-end routine that answers “why?”
- 1
Map cloud scopes to projects
Subscriptions, resource groups or cloud projects per product or client. It is the cheapest change with the biggest effect. - 2
Tag at creation, not at review
Make the project tag part of the infrastructure template so new resources arrive labelled. - 3
Compare by project, month over month
The invoice total moves for many reasons. One project’s cost moving is a specific question. - 4
Put cost next to what shipped
When a project’s cloud cost rises, look at that project’s deploys in the same weeks. That is usually where the answer is. - 5
Keep unassigned spend visible
Show untagged cost as its own line with an owner. Spreading it across projects hides the problem.
Where Nythrex fits
Nythrex reads cloud cost from Azure and Google Cloud with read-only access and counts it at project level, next to the same project’s tasks, pull requests, CI and deploys. It does not split cloud across individual changes, because that would be a guess. A named rule flags cloud spend with no owner, with the records and arithmetic behind the amount.
Sources
Frequently asked questions
How much cloud spend is wasted?
Respondents to Flexera’s 2026 State of the Cloud survey estimate 29% of their cloud spend is wasted, up from 27% the year before. It was the first increase in five years.
How do I find out why my cloud bill went up?
Compare cost by project rather than by service. Map subscriptions or resource groups to projects, check which project’s cost rose, and look at what that project deployed in the same weeks.
Do I need a FinOps team to control cloud costs?
Not to start. Assigning every cloud resource to a project, tagging at creation and reviewing project cost next to what shipped answers most month-end questions in a team of tens of engineers.
Read next
- 98% of FinOps teams now manage AI spend. Most still can’t say what it boughtThe FinOps Foundation’s 2026 survey shows AI cost management went from niche to nearly universal in two years. The hard part is still attribution and value, and AI in engineering is the least visible piece.Read
- The AI bill nobody owns: seats, credits, API keys and the corporate cardAI reaches software companies through seats, usage credits, API keys and expense reports. Finance sees vendors, engineering sees tools, and nobody sees the total by product. Here is how to fix it before the next renewal.Read
- Engineering cost recommendations with evidence and mathNythrex rules find AI sessions with no commit, expensive models on helper requests, redundant CI runs, unowned cloud spend and abandoned work — with records and arithmetic.Read
Stop guessing.
Start seeing.
No card and no subscription: paid plans have not launched yet.