
Analysis · DORA
DORA puts a price on AI-assisted development: the J-curve, the verification tax and the real drivers of return
DORA spent a decade teaching the industry to measure software delivery. Its report The ROI of AI-Assisted Software Development applies the same discipline to money. It offers a formula, a calculator and an illustrative model, and it spends most of its pages warning that the return depends less on the tools than on the organisation around them.
Nythrex team · 10/28/2026
In brief
7-minute read · Updated 28 October 2026
- AI is an amplifier. Returns depend on platform quality, workflow clarity and team alignment, not on the tools alone.
- Expect a J-curve. A temporary dip comes from learning, the verification tax of reviewing AI code and downstream processes that have not adapted.
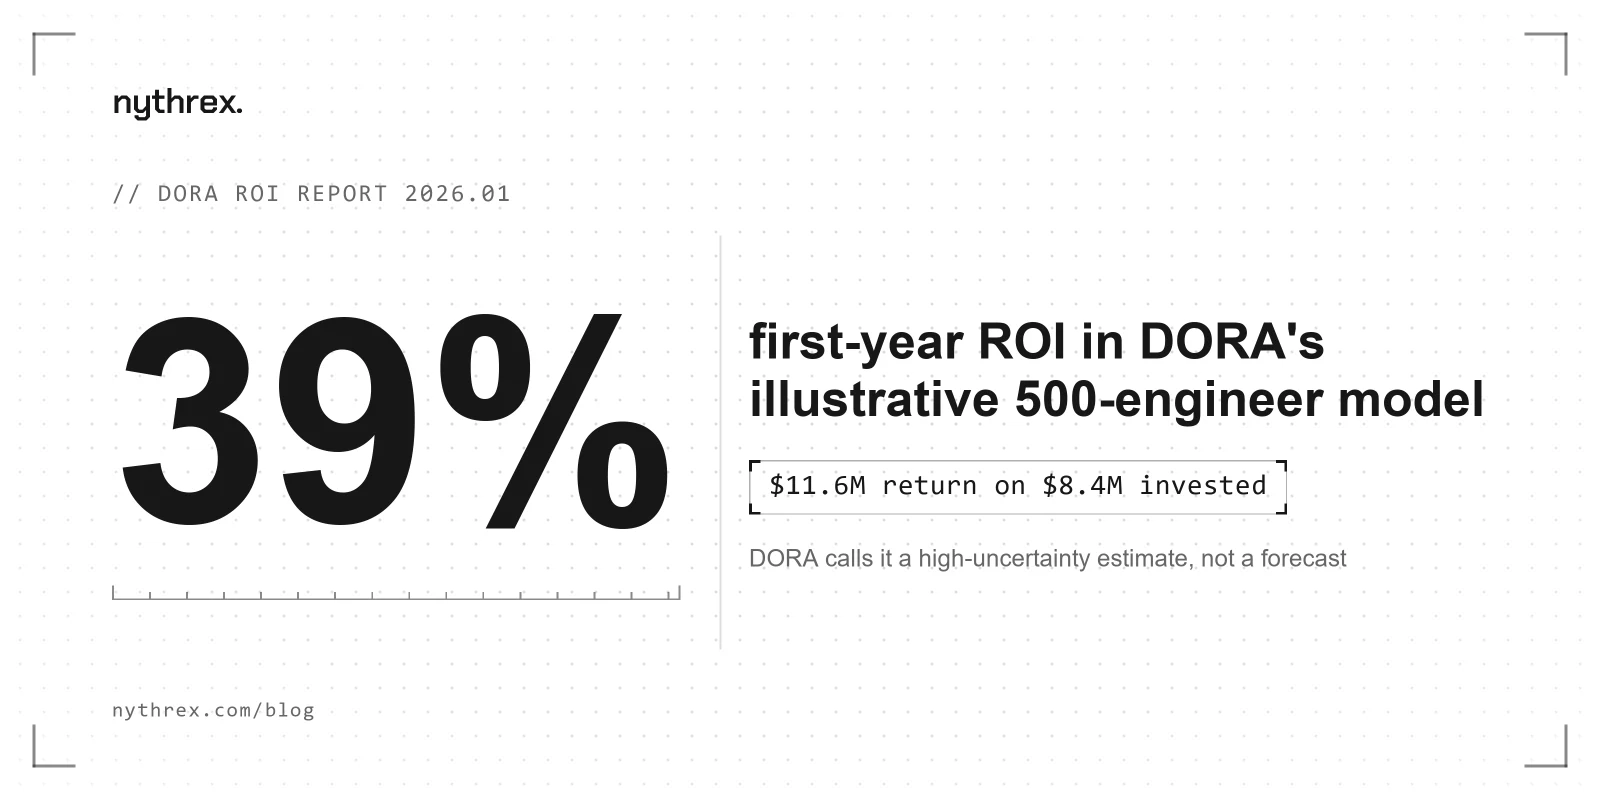
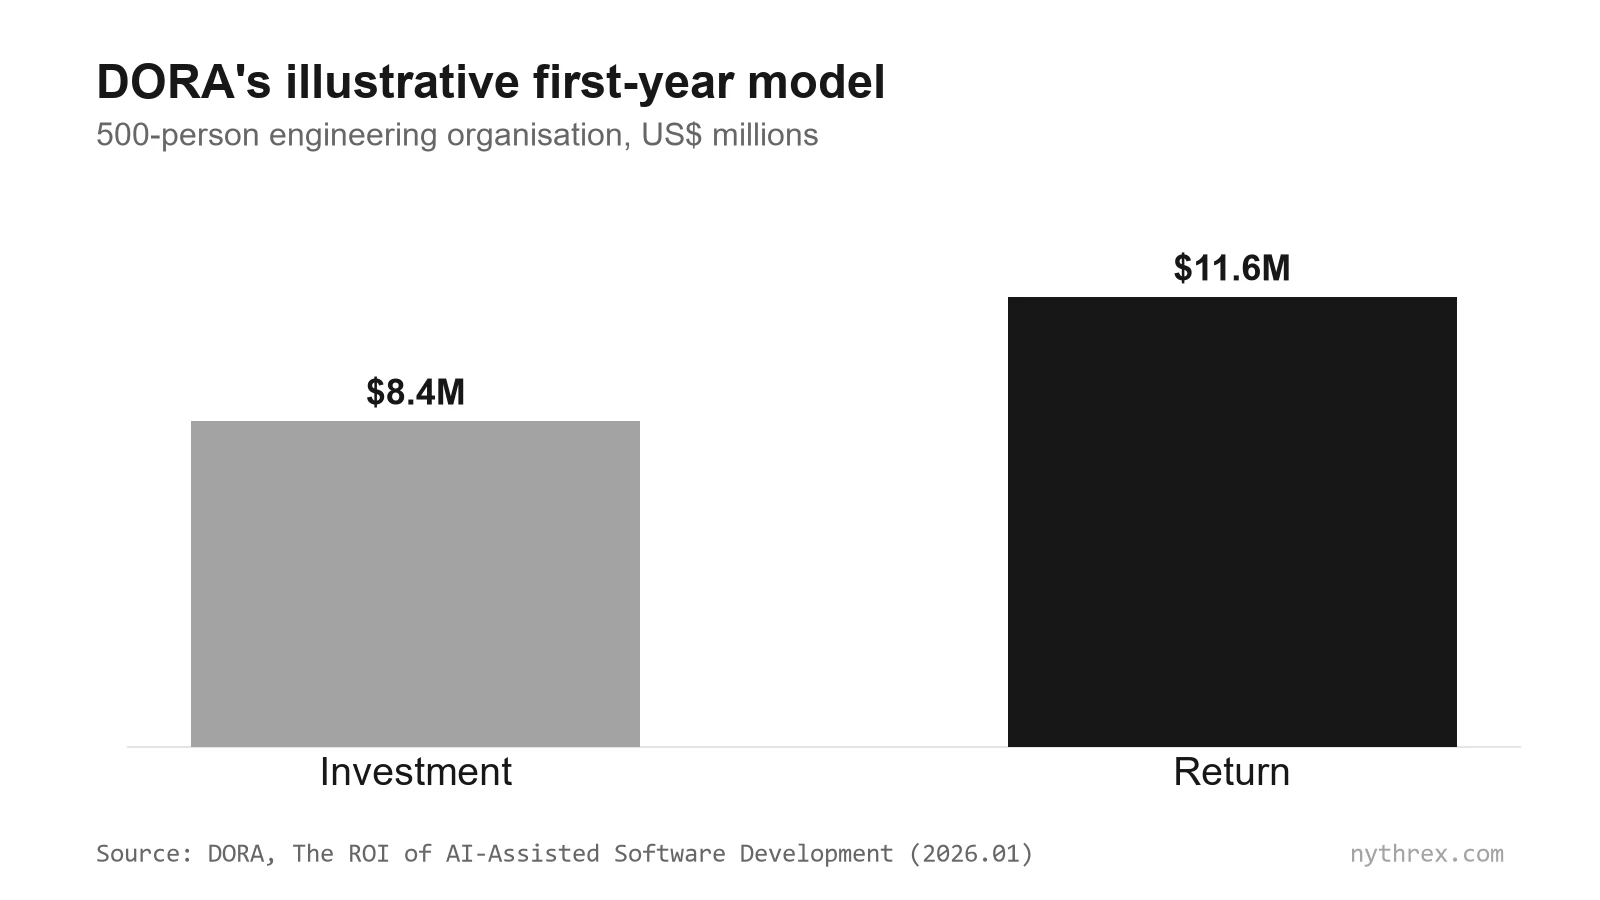
- An illustrative 39%. In DORA’s 500-engineer model, $8.4M invested returns about $11.6M in year one, with payback in about eight months.
- Gains depend on the work. Research cited in the report puts them at 35–40% on simple greenfield tasks and about 10% or less on complex legacy code.
The model in one picture
The formula is the classic one: return equals value minus investment, divided by investment. The interesting part is how value is built. DORA traces it from capabilities such as a quality internal platform, version control practices and AI-accessible internal data, to delivery metrics, to developer and user experience, and only then to cost savings and revenue.
The J-curve and the verification tax
The most useful part of the report is its warning about the first months. Teams have to learn the tools. Someone has to verify what the AI wrote, and that review is slower than people expect. Testing and change approval were built for a slower flow of changes. Together they produce a dip before the gains, which DORA describes as the tuition cost of transformation.
Leaders who read the dip as failure may cut the funding just before the return arrives.
There is a second tax. Earlier DORA research linked AI adoption to more delivery instability. The report’s sample calculator raises the change failure rate from 5% to 6% and puts the cost of the extra downtime at about $344,000. Its advice is to invest in automated testing, continuous integration and small batches rather than to slow down adoption.
Where the gains are
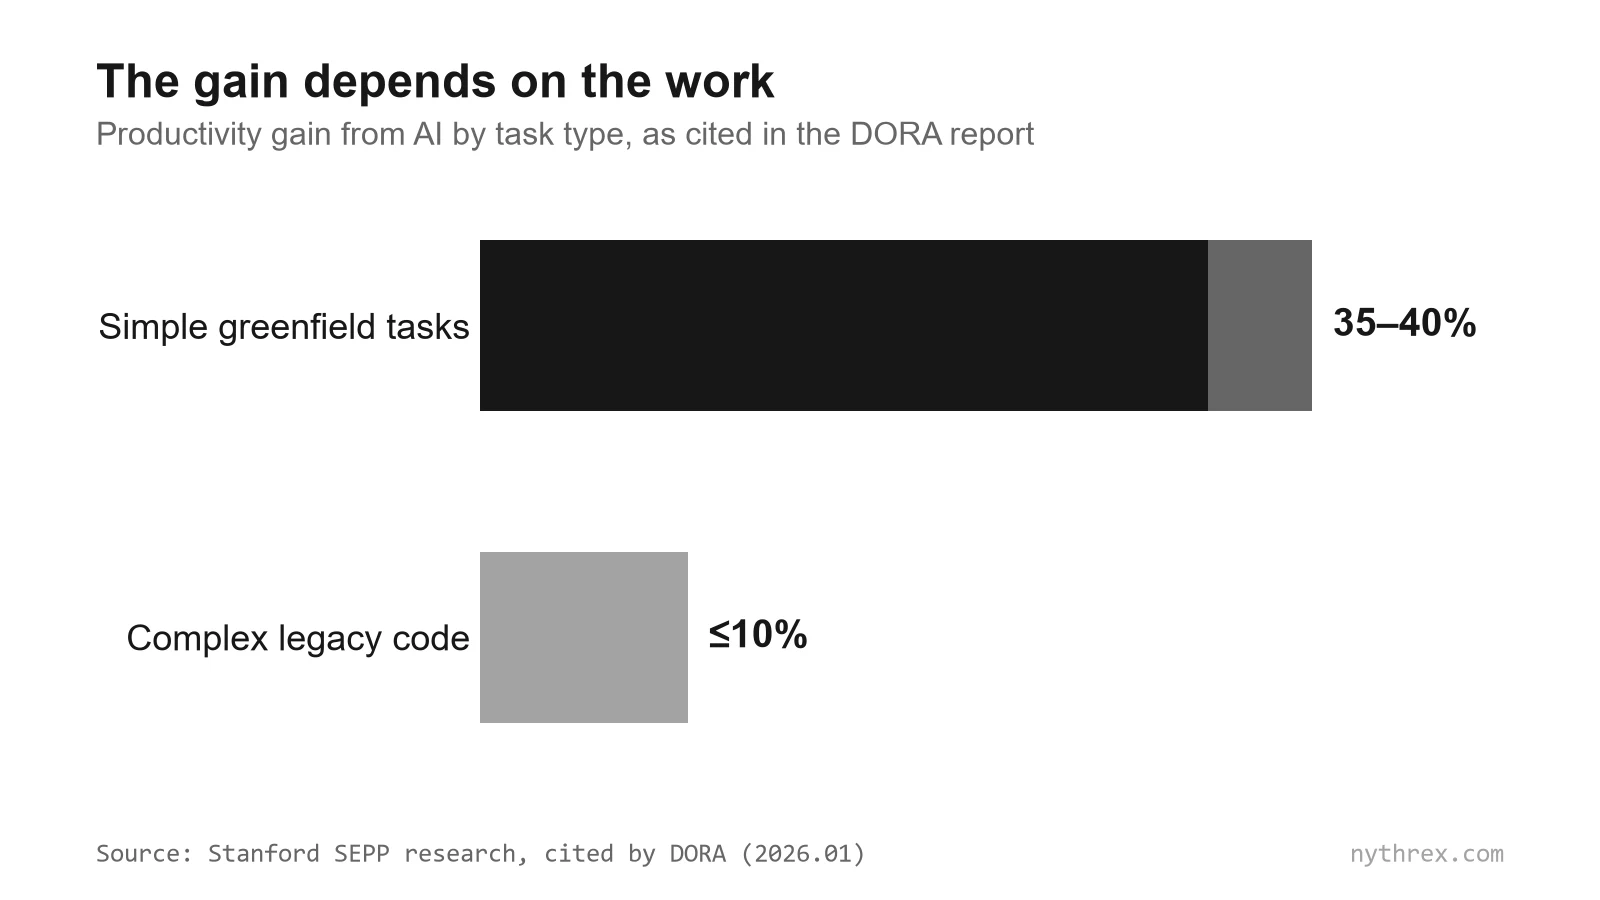
Averages hide the spread. The report cites Stanford research showing a large gain on simple new code and a small one on complex legacy systems. It also notes that inference prices fell about 280 times between late 2022 and late 2024, which makes the investment side cheaper every year while the value side still depends on the work.
90%
of technology professionals used AI at work in DORA’s 2025 research.~8 months
payback in the illustrative model, with returns expected to compound in years two and three.No cuts
DORA discourages headcount reduction as an AI strategy and favours retention and training.
Using the framework with real numbers
- 1
Count the whole investment
Seats, credits, API usage, extra CI and the time spent learning. The tooling line is only part of it. - 2
Measure value at the delivery level
Lead time, deployment frequency and change failure rate say more than keystrokes or accepted suggestions. - 3
Run three scenarios
DORA recommends conservative, realistic and optimistic estimates instead of one confident number. - 4
Watch the instability tax
Track change failures and rework alongside speed, or the downtime will cancel the gain. - 5
Re-measure after the dip
A first-quarter number is the tuition, not the result.
Where Nythrex fits
Every ROI calculation needs an honest investment figure. Nythrex provides that side for engineering: the AI, CI and cloud cost of each change, with the basis of each number shown. It does not measure people’s productivity or rate individuals.
Sources
Frequently asked questions
What is DORA’s ROI of AI-assisted software development report?
A 2026 report from Google Cloud’s DORA team that offers a framework, a calculator and an illustrative model for estimating the financial return of AI in software delivery. Its central claim is that AI amplifies the strengths and weaknesses of the organisation around it.
What is the verification tax?
The extra time needed to review and verify AI-generated code. DORA names it as one of three causes of an early productivity dip, together with learning and downstream processes that have not adapted.
What ROI does DORA estimate for AI-assisted development?
In its illustrative 500-engineer model, about $11.6 million of first-year value on $8.4 million invested, a 39% ROI with payback in about eight months. DORA calls this a high-uncertainty estimate and recommends running several scenarios.
Read next
- 98% of FinOps teams now manage AI spend. Most still can’t say what it boughtThe FinOps Foundation’s 2026 survey shows AI cost management went from niche to nearly universal in two years. The hard part is still attribution and value, and AI in engineering is the least visible piece.Read
- Faster code, same delivery? What AI is really doing to the pace of software developmentAI coding tools made writing code dramatically faster. Shipping software did not speed up by the same amount. An essay on where the time actually goes, why the bottleneck moves, and why the world is not accelerating evenly.Read
- Why Nythrex: AI development costs you can explainWhat makes Nythrex different: the cost of every change from AI prompt to production, recommendations with arithmetic, unknown is never zero, no code or prompts stored.Read
Stop guessing.
Start seeing.
No card and no subscription: paid plans have not launched yet.